Data Observability
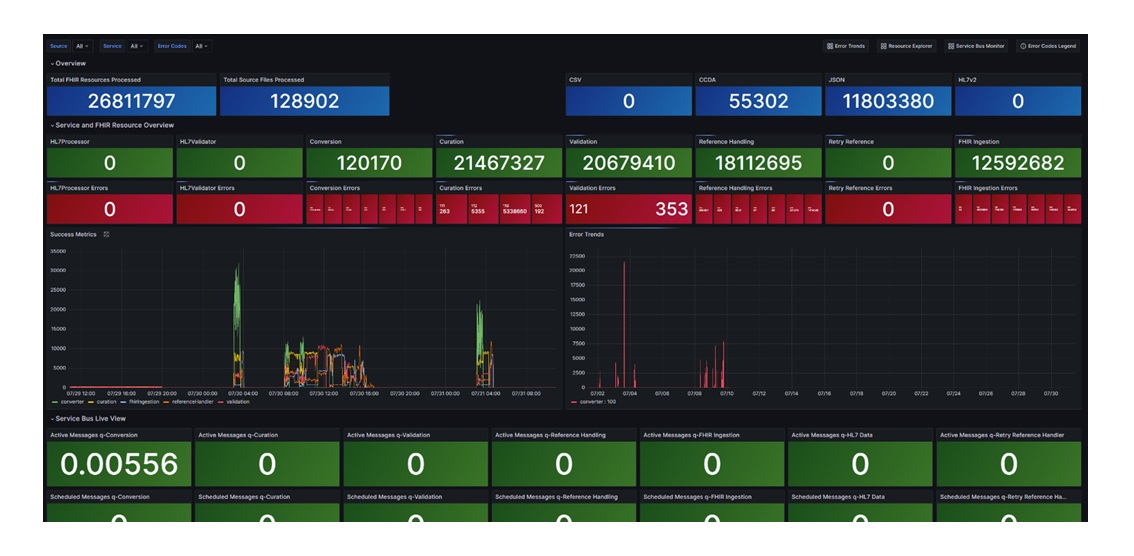
Centaur® Data Platform’s Data Observability Dashboard provides comprehensive, real-time visibility into each pipeline’s data processing stage, allowing users to manage data quality and processing efficiency proactively.
The dashboard empowers users to:
- Track end-to-end data progress, ensuring the timely completion of critical workflows.
- Identify bottlenecks and inefficiencies in real-time, helping optimize processing speed and accuracy.
- Set custom alerts for failure or processing delays, allowing teams to respond quickly to issues.
Furthermore, performance metrics integrated into the dashboard give users the ability to capture and visualize resource usage. The dashboard is designed to scale effortlessly, maintaining reliable performance as your data needs grow.
Key Components of the Data Observability Dashboard:
- Overview: Displays total files processed by Centaur®, breaking down the types of files received for conversion.
- Total Source Files Processed: The number of source files processed within the given time frame.
- Total FHIR® Resources Processed: The number of FHIR® resources processed, including any reprocessed references.
- Total Source Formats: The count of CCDA, HL7™ messages, JSON, or CSV files ingested.
- Service and FHIR® Resource Overview: Offers a snapshot of the success and failure counts for various components within Centaur®.
- HL7™ Engine Processor: Displays the count of files successfully processed versus those that failed, as reported by the Azure service bus queue.
- HL7™ Validator: Indicates the success/failure rate for file validation, commonly referencing error codes such as 171 and 172 for validation failures.
- Conversion: Shows the count of files successfully converted to FHIR® resources and those that failed during conversion.
- Curation: Tracks files that have been successfully curated, and those that failed during the curation process.
- Validation: Lists the number of FHIR® resources validated against HL7™ FHIR® IG specifications.
- Reference Handling & Retry: Highlights the handling of references in FHIR® resources, including retry attempts where necessary.
- FHIR® Ingestion: Monitors the ingestion success/failure rates of FHIR® resources into the server.
- Success Metrics: Provides time-series visualizations of successful outcomes for each component, helping users analyze platform performance over time.
- Error Trends: Visualizes the error trends for each component, enabling users to pinpoint recurring issues and their root causes.
- Memory Usage: Tracks the memory usage of each Centaur® Data Platform service container app, providing a real-time view of resource consumption.
